Implementing an Enterprise Resource Planning (ERP) system stands as one of the most transformative yet financially daunting initiatives an organization can undertake. While a successful rollout unifies fragmented business operations, streamlines supply chains, and unlocks real-time operational intelligence, missteps frequently result in budget overruns, operational friction, and delayed time-to-value.
Evaluating your project against established industry benchmarks provides clear performance indicators to control implementation risks, manage executive expectations, and keep digital transformation initiatives on track.
Understanding Core ERP Implementation Benchmarks
Benchmark metrics serve as a critical reality check across the primary dimensions of an ERP journey: implementation timelines, budget allocations, return on investment (ROI) realization, and post-go-live adoption rates.
- Implementation Timelines: Industry data indicates that mid-market deployments typically span 6 to 14 months, whereas complex global enterprise rollouts regularly require 18 to 30 months. Variations stem from organization size, customization levels, and legacy data complexity.
- Budget Allocations and Cost Structures: Total cost of ownership (TCO) benchmarks generally range from 3% to 5% of annual company revenue for mid-market firms, dropping to 1% to 3% for large multi-billion-dollar enterprises due to economies of scale.
- Overrun Frequency: Standard industry surveys reveal that over 50% of ERP implementations exceed their original timeline estimates, while roughly 45% exceed their initial budgets.
- ROI and Value Realization: Organizations typically begin seeing measurable operational efficiencies and cost reductions within 12 to 24 months post-implementation, with full payback achieved within 3 to 5 years.
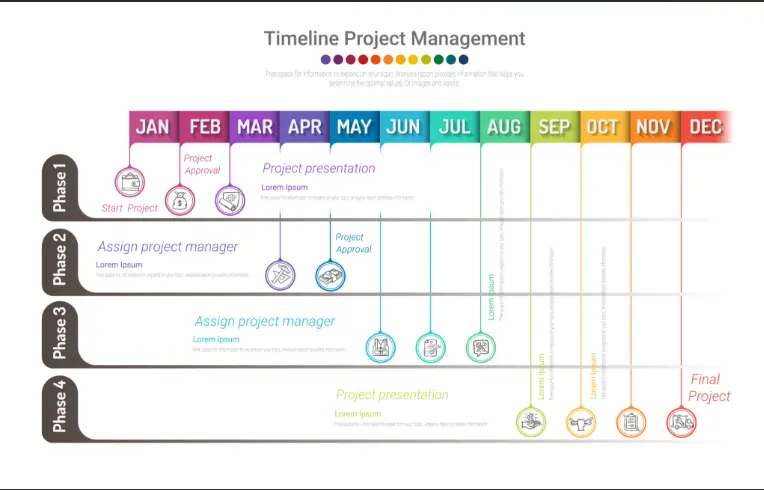
Financial Benchmarks: Budgeting Beyond Software Licensing
A common pitfall in ERP financial planning is focusing solely on upfront software subscription or licensing fees. Modern benchmarks show that licensing fees represent only 15% to 30% of the overall implementation cost.
The remaining total expenditure breaks down across key categories:
- Implementation Partner and Consulting Fees: Third-party integration support, architecture design, and technical configuration usually constitute the single largest cost component, often accounting for 40% to 50% of total expenditure.
- Data Migration and Systems Integration: Clean-up, extraction, transformation, and loading (ETL) of legacy data along with building API connectors for existing platforms typically represent 10% to 15% of the overall budget.
- Change Management and End-User Training: Often underfunded, effective organizational change management demands 10% to 15% of total project resources to ensure user adoption and process alignment.
- Post-Implementation Contingency: Industry standards recommend allocating a dedicated 15% to 20% buffer above the primary baseline budget to absorb unexpected scope shifts or technical complexities.
Timeline Expectations Across Deployment Models
Timeline benchmarks differ substantially depending on whether an organization chooses Cloud SaaS, On-Premise, or Hybrid deployment models.
- Cloud-Native SaaS Deployments: Leveraging pre-built industry configurations and standard processes, cloud deployments range from 4 to 9 months for mid-market organizations and 9 to 18 months for large enterprises.
- Hybrid and Multi-Entity Deployments: Integrating cloud extensions with core legacy architectures typically requires 12 to 20 months.
- On-Premise or Highly Customized Environments: Traditional infrastructure rollouts involving heavy custom code development frequently extend from 18 to 36 months.
Critical Success Factors Driving Benchmark Performance
Achieving benchmark-level efficiency or beating industry averages hinges on several critical operational choices made long before software deployment begins:
- Scope Control and Minimizing Customizations: Organizations that stick closely to out-of-the-box business processes complete implementations up to 40% faster and experience significantly lower budget variances compared to those pursuing extensive custom development.
- Executive Sponsorship and Governance: Projects backed by an active executive steering committee boasting clear decision-making protocols are 70% more likely to stay within planned timelines.
- Data Readiness Prior to Kickoff: Cleaning, deduplicating, and restructuring master data (customers, vendors, chart of accounts, bill of materials) prior to software installation prevents costly delays during system integration testing.
- Structured Organizational Change Management (OCM): Dedicated OCM frameworks ensure user resistance is addressed early, accelerating time-to-productivity once the system is live.
Analyzing industry implementation benchmarks provides executives with the objective baseline necessary to establish realistic budgets, build defensible project timelines, and guide digital transformation investments toward measurable operational value.